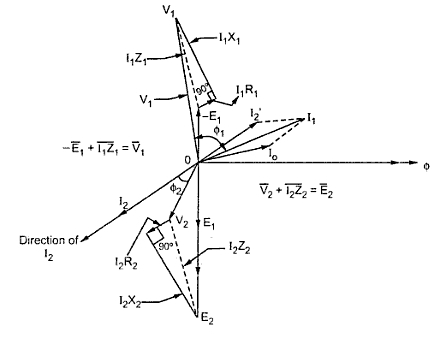
Unlocking Transformer Secrets: Decoding the Full Load Phasor Diagram
Ever wondered how engineers predict the behavior of power transformers under pressure? The secret lies in a powerful visual tool: the phasor diagram of a transformer at full load. This diagram isn't just a collection of lines and arrows; it's a roadmap to understanding the complex relationship between voltage, current, and power within a transformer operating at its maximum capacity.
Imagine a transformer humming away, delivering power to homes and businesses. A full load phasor diagram provides a snapshot of the electrical quantities within the transformer at that very moment. By representing these quantities as rotating vectors, or phasors, the diagram reveals the phase relationships between them, offering crucial insights into the transformer's performance.
The concept of representing AC quantities as phasors emerged with the development of AC power systems in the late 19th century. Engineers needed a way to visualize and analyze the complex interactions of alternating voltages and currents. The phasor diagram became an indispensable tool, providing a graphical representation that simplified complex calculations and aided in the design and operation of electrical equipment, including transformers.
Phasor diagrams are essential for understanding transformer behavior under various load conditions, especially full load. They help predict voltage drops, current magnitudes, and power factor, enabling engineers to optimize transformer design and ensure efficient power delivery. Identifying potential issues like overloads or imbalances becomes significantly easier with these diagrams.
Several types of phasor diagrams exist for transformers, depending on the load type (resistive, inductive, capacitive) and whether the transformer is operating in a leading or lagging power factor scenario. For a resistive load, the voltage and current phasors are in phase. With an inductive load, the current phasor lags the voltage phasor, while with a capacitive load, the current phasor leads the voltage phasor.
A full load phasor diagram for a transformer considers the effects of the load current on the transformer's internal parameters, such as resistance and reactance. It provides a visual representation of how the load affects the voltage regulation and efficiency of the transformer.
Let's consider a simple example. A transformer supplying a resistive load at full capacity will have its voltage and current phasors aligned, indicating a unity power factor. However, if the load is inductive, the current phasor will lag the voltage phasor, representing a lagging power factor. This lagging current increases the transformer's internal losses and reduces its efficiency.
Benefits of utilizing phasor diagrams include: 1) Visualizing phase relationships: Phasor diagrams make it easy to see the phase difference between voltage and current, crucial for understanding power factor and reactive power flow. 2) Simplifying complex calculations: They provide a graphical method to analyze AC circuits, avoiding complex algebraic manipulations. 3) Predicting transformer behavior: Phasor diagrams help predict how a transformer will perform under different load conditions, assisting in design and operation optimization.
Constructing a full load phasor diagram typically involves representing the primary and secondary voltages and currents as rotating vectors, taking into account the transformer's turns ratio and the load impedance. The diagram visually depicts the phase shifts and magnitude relationships between these quantities.
Advantages and Disadvantages of Phasor Diagram Analysis
| Advantages | Disadvantages |
|---|---|
| Visual representation of complex relationships | Simplified representation, ignoring some real-world factors |
| Simplified analysis of AC circuits | Can become complex for intricate transformer configurations |
| Predictive capabilities for transformer behavior | Requires understanding of phasor concepts and conventions |
FAQ:
1. What is a phasor? A phasor is a rotating vector representing a sinusoidal quantity.
2. Why are phasor diagrams used for transformers? They help visualize and analyze the AC quantities in a transformer.
3. What does a full load phasor diagram represent? It shows the state of the transformer at maximum capacity.
4. How does load type affect the phasor diagram? It influences the phase relationship between voltage and current.
5. What is the significance of the power factor in a phasor diagram? It indicates the efficiency of power transfer.
6. How can I learn more about phasor diagrams? Consult electrical engineering textbooks and online resources.
7. What software can be used to create phasor diagrams? Specialized electrical engineering software packages.
8. Are there limitations to phasor diagram analysis? Yes, it simplifies some aspects of real-world transformer behavior.
In conclusion, the phasor diagram of a transformer at full load is a powerful tool for understanding and predicting transformer behavior. It provides valuable insights into the complex relationships between voltage, current, and power within the transformer under load. While simplified, it offers a crucial visual representation that aids in design, operation, and troubleshooting. By mastering the art of interpreting these diagrams, engineers can unlock the secrets of efficient power delivery and ensure the reliable operation of our electrical grid. Explore the resources available online and in textbooks to deepen your understanding of this essential tool for electrical engineering.
Who owns boston dynamics the story of the robotics powerhouse
Ryan reynolds actor height in feet unveiling the facts
Black cherry cola weed strain


